

GSE Profiler
Developer-approvedTomáš Gažovič
Debug, profile and manage GNOME Shell extensions
Copied! Paste it into a terminal and press Enter to install.
About
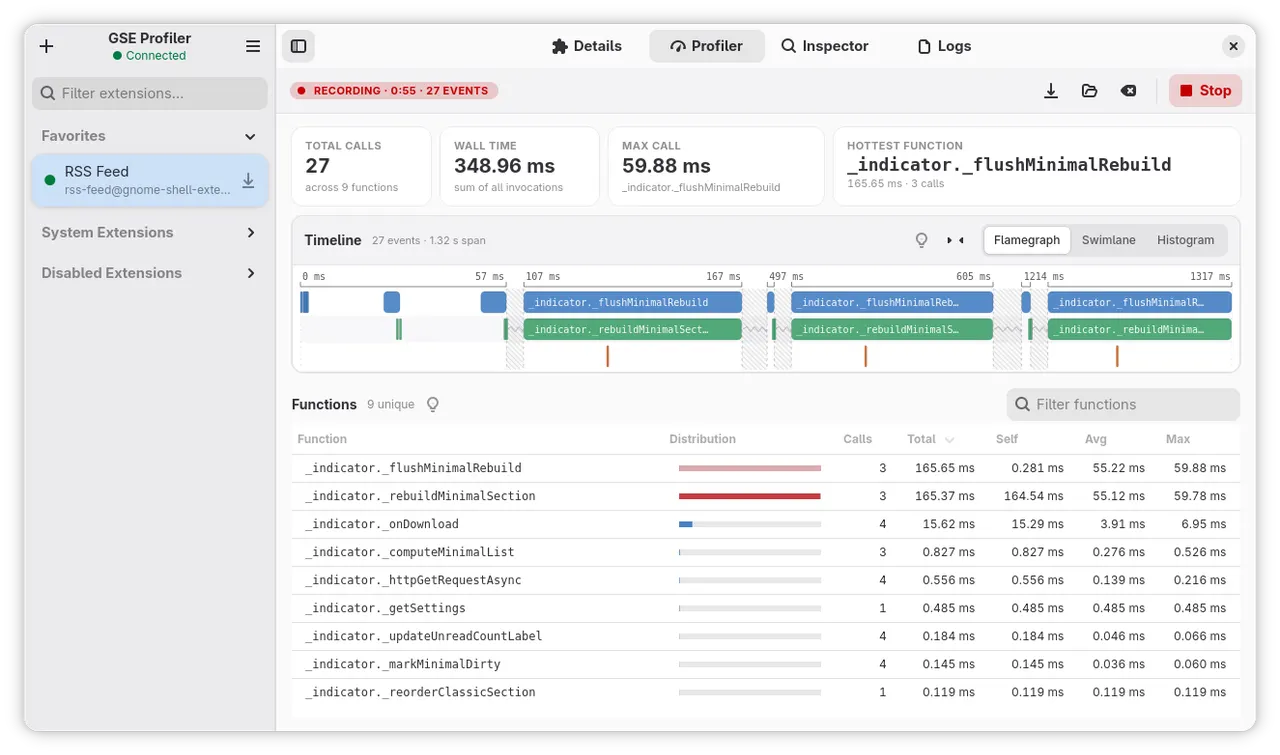
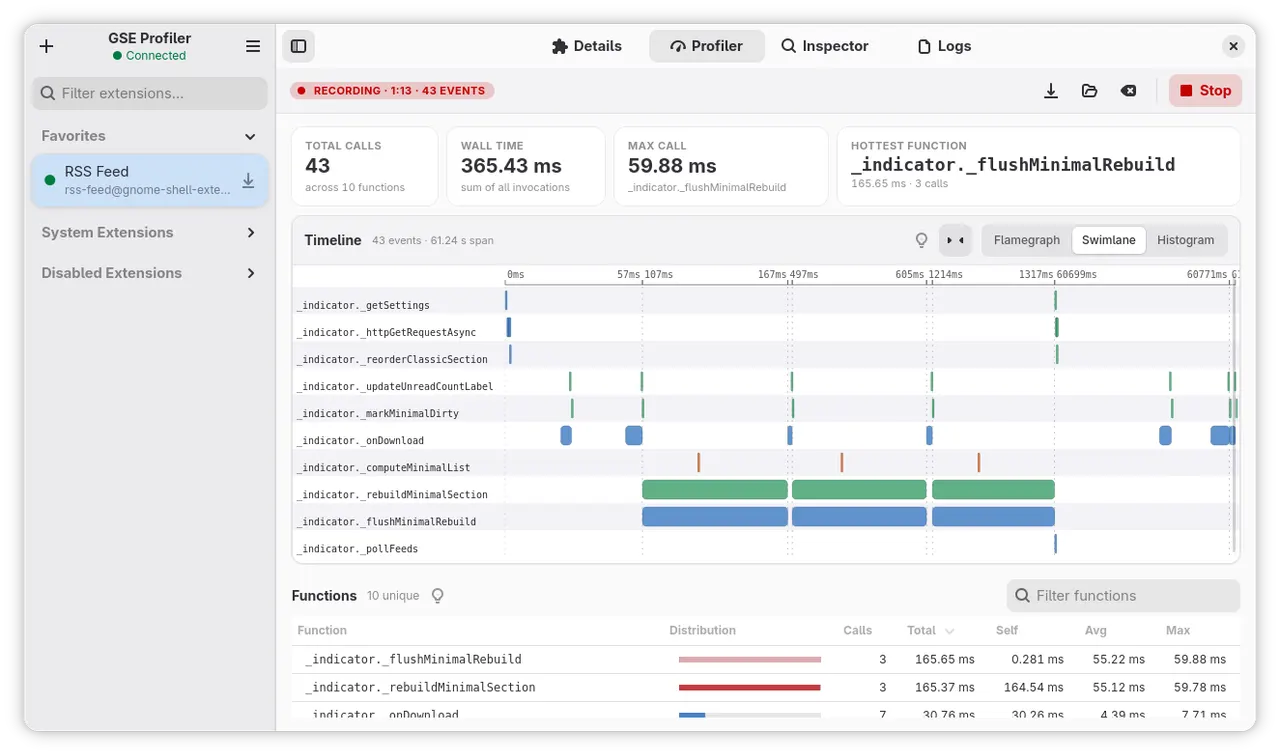
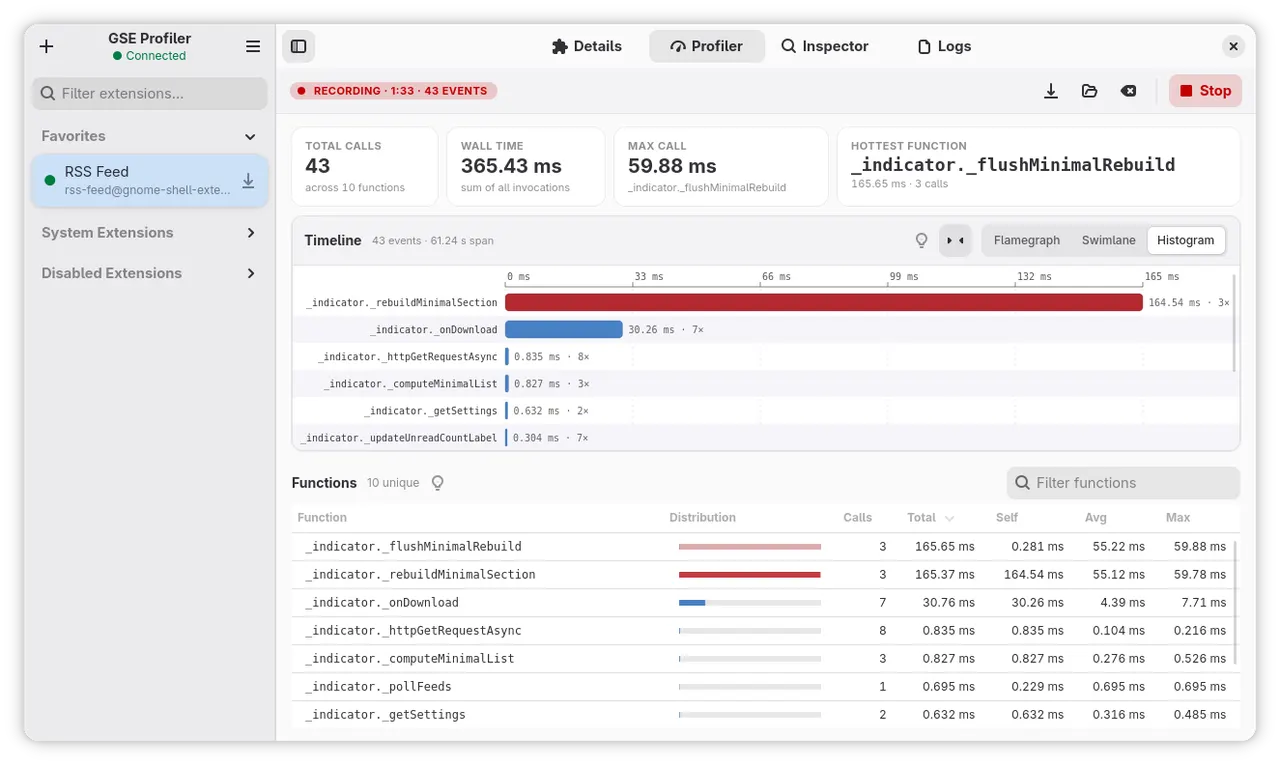
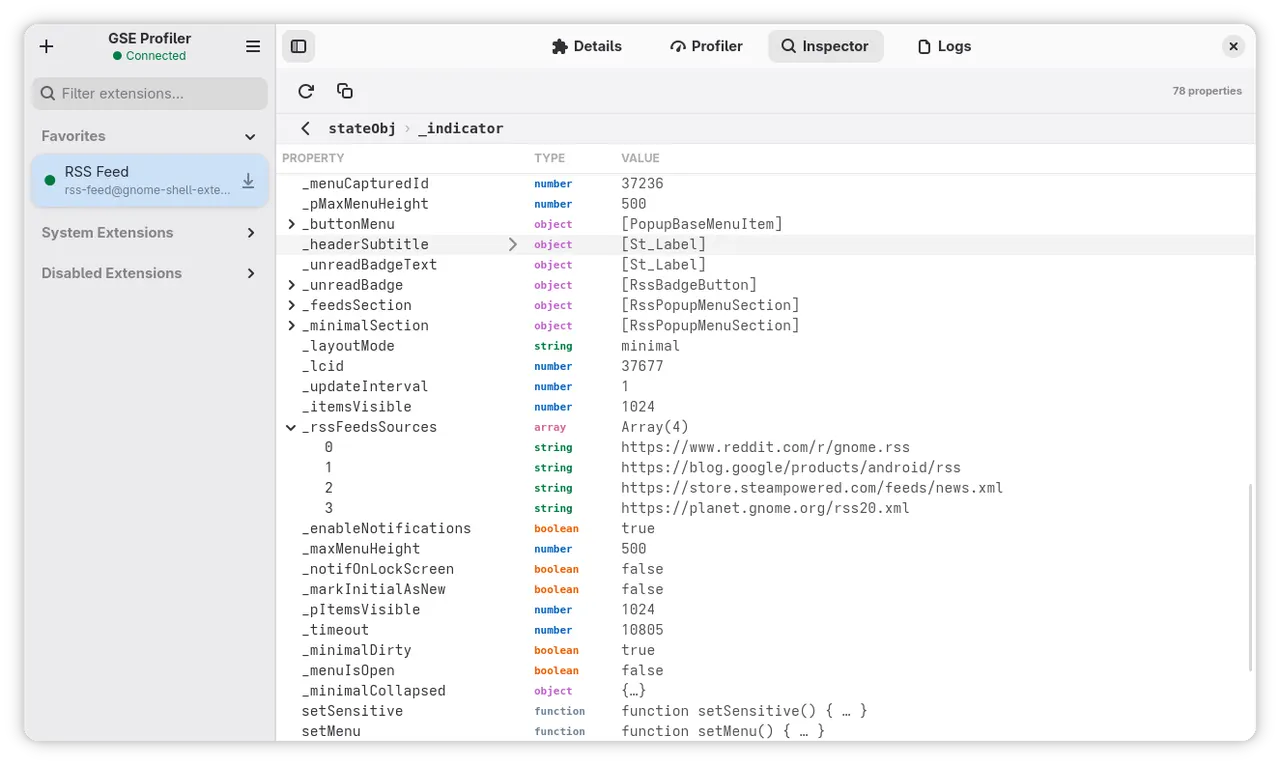
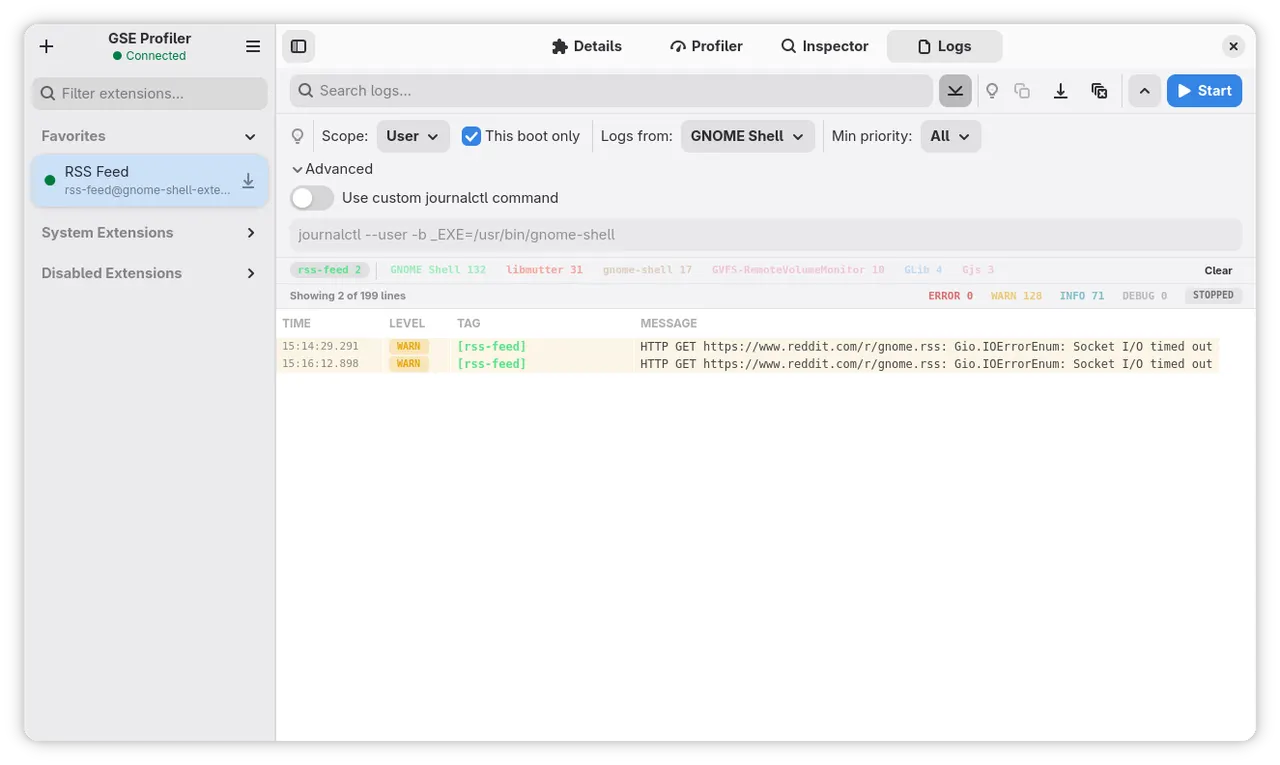
GSE Profiler is a GTK4 desktop application for managing, debugging, and profiling GNOME Shell extensions. It communicates with a bridge extension running inside gnome-shell to provide live function timing, a flame graph visualizer, a filterable log viewer, and a read-only state inspector.
Features:
- Extension manager with enable/disable toggle and state badges
- Live log viewer with UUID filter, log-level filter, and full-text search
- Flame graph profiler with per-function highlighting and call table
- Inspector for browsing extension stateObj properties at runtime
Why this app needs the listed permissions:
- GNOME Shell extensions folder — to install the bridge extension and extensions fetched from GitHub.
- User runtime folder gse-profiler — Unix socket used by the bridge extension to talk to the app.
- System journal (read-only) — to show GNOME Shell and extension logs in the built-in log viewer.
- org.gnome.Shell — to list, enable, disable and inspect installed extensions via the org.gnome.Shell.Extensions interface.
- org.gnome.SessionManager — to log out the session after the bridge is installed or removed, so GNOME Shell picks up the change.
- Network access — to download GNOME Shell extensions from GitHub on user request and to check whether an installed GitHub-sourced extension has a newer upstream commit. Used only for explicit user actions and a one-shot update check at app start; no telemetry or background traffic.
What's New
v1.4.0 · 2026-08-23Added:
- GNOME 51 support — the bridge now declares shell-version 51, so GNOME 51 loads it instead of refusing it as out of date.
- Measured instrumentation overhead — every recording starts by timing the profiler's own wrapper against an empty function; rows whose average per-call time falls at or below that cost, or below the microsecond clock floor, are dimmed with an explanation on hover, and the measured figure is shown with the scan details. Dimmed rows keep their call counts, which remain exact.
Fixed:
- Profiler discovery now traverses Arrays, Map values, and Set values, so extensions that keep their modules in a collection — a Map of modules keyed by name, and similar — are instrumented instead of skipped (#23).
- Profiler discovery walks the object graph breadth-first, so a first sibling holding bulk cached data no longer consumes the whole visit budget and starves the objects carrying the extension's actual behaviour.
- Reaching the visited-objects limit now only marks the scan as truncated instead of stopping discovery outright; the hard stop is reserved for the instrumented-function limit.
- The bridge's bundle-hash now covers metadata.json, so a change to shell-version, uuid, or settings-schema triggers the reinstall prompt instead of leaving an outdated copy on disk.
Details
- Developer
- Tomáš Gažovič
- License
- GPL-3.0-or-later
- Version
- 1.4.0 · 2026-08-23
- Website
- Homepage
- Source
- GSE Profiler
- Packaging
- flatpark/registry
Permissions
5 to reviewFiles: /run/log/journal:ro
Files: /var/log/journal:ro
Files: ~/.local/share/gnome-shell/extensions:create
Files: xdg-run/gse-profiler:create
Network access
Can reach the internet and local network
Inter-process communication
Shares the IPC namespace with the host
Talk to org.gnome.Shell
Talk to org.gnome.SessionManager
Wayland display
GPU acceleration